Census Metropolitan Unemployment Rates Across Ontario
Click Here to See Larger Image
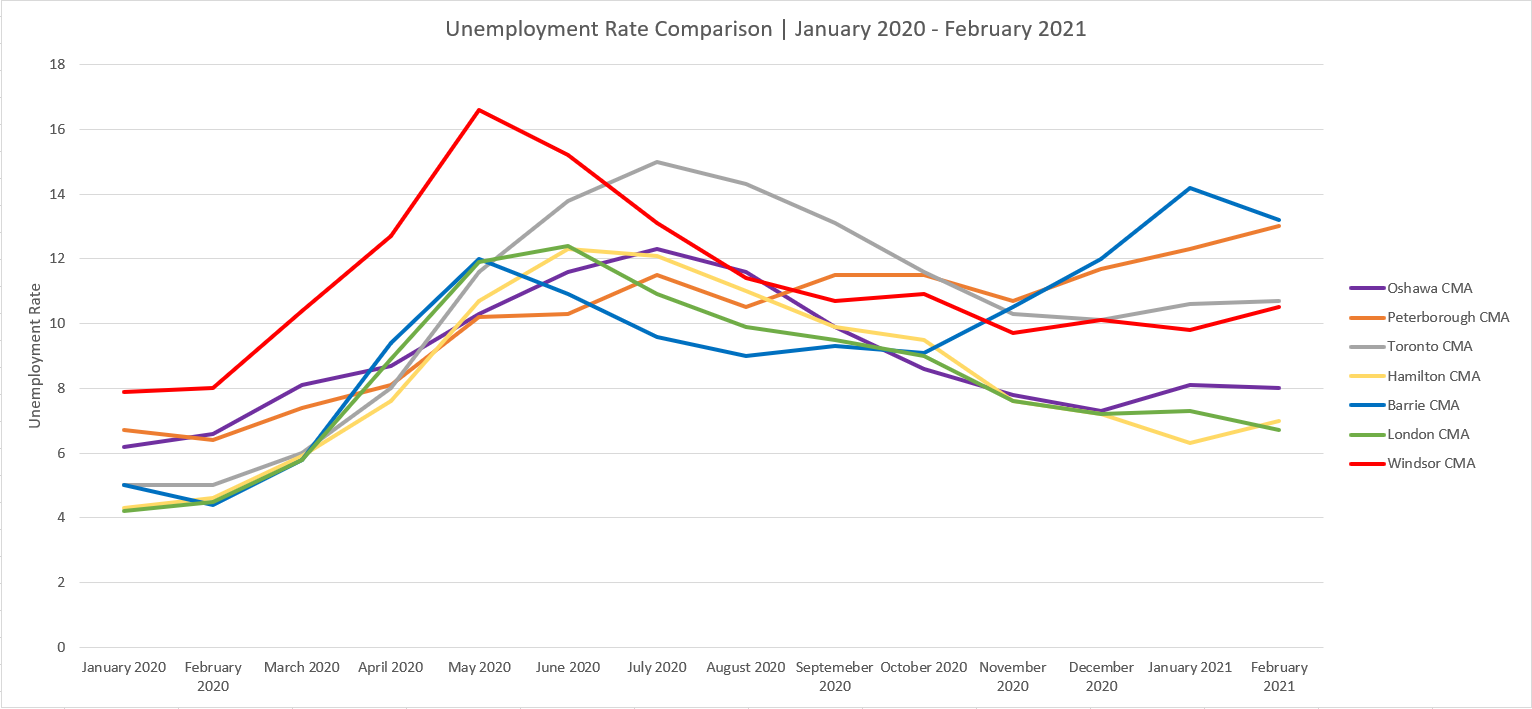
The Unemployment Rate Comparison graph provides a visual display of the monthly unemployment rates for various Census Metropolitan Areas (CMA) across Ontario. The unemployment rate is the number of unemployed persons expressed as a percentage of the labour force. Estimates are percentages, rounded to the nearest tenth.
The Oshawa CMA is comprised of Oshawa, Whitby and Clarington. The Oshawa CMA is used as a data proxy in Durham Region as Pickering, Ajax and Uxbridge are part of the Toronto CMA and Brock and Scugog are not surveyed in the monthly report due to population size. The Oshawa CMA includes the most Durham Region residents and provides the best depiction of the labour market in the Region as a whole.
The Unemployment Rate Comparison graph reflects many of the job losses and recoveries experienced across various areas in the Greater Golden Horseshoe as a result of COVID-19. Now almost one year into COVID, we are seeing some of the extended effects of COVID-19 on the Canadian economy. Initially, in March 2020 as public health measures were first implemented, there was a spike in all areas across the Greater Golden Horseshoe. We saw a gradual decline throughout the summer and into the autumn months as various businesses began to re-open after the first wave of the virus. Looking at January and February 2021, we can now see the lingering effect of the second wave on unemployment. While Barrie CMA had a major spike in January, we are now seeing a gradual decline as businesses are able to reopen – Barrie now sits at a 13.2% unemployment rate.
Peterborough CMA now sits at 13% with a continual upward trend in unemployment since November, now competing with Barrie CMA. Toronto and Windsor have similar unemployment rates at 10.7% and 10.5%, respectively. The effect of the second wave on unemployment in the Oshawa CMA has not been as severe as the first. While Oshawa CMA saw a smaller bump in January 2021, it held nearly the same in February 2021 at 8%.
In Ontario, the highest unemployment rate in February 2021 was 13.2% in the Barrie CMA. The lowest unemployment rate in the province is 6.2%% in the Ottawa-Gatineau CMA. Looking forward the data should reflect the regional approach to the implementation of stricter public health measures, with some regions placed in grey and others in different zones of Ontario’s colour-coded system. In the coming months, the data could also begin to show the effect of the vaccine rollout in the province.
Source: Statistics Canada. Table 14-10-0378-01, Labour force characteristics, three-month moving average, unadjusted for seasonality (March 2021).