
Archive
Guest Blog: Natalie Prychitko
Leave a CommentThe Durham Workforce Authority (DWA) is a community-based not for profit that has been around for over 20 years. With deep ties in our community, the DWA provides labour market data and related support to the business community.
I appreciate the DWA’s engagement with our chamber and championing the information available at our fingertips; and as soon as I dive into their website, I realize the depth and breadth of information available to our membership.
Personally, I was thrilled to see the use of video and the data being delivered in bite-size pieces. Check out their Labour Market Information Video Series that provides access to labour market information in a way that businesses can leverage as they consider their recovery & growth strategies. The videos take the monthly labour force survey data, local custom data and other critical pieces of labour market information and provide it in an easy to understand format.
Want to learn more about the Region you’re doing business in? Check these out: https://www.youtube.com/channel/UCuajyExGKYiLt7imbRZgUng
Do It In Durham Entrepreneurship Week 2021
Leave a CommentDo It In Durham Entrepreneurship Week is a collaboration of Durham’s business support, educational and networking organizations who have come together to encourage and support entrepreneurs, job creators and innovators who create economic growth in Durham Region.
This year, there will be over 35 ‘virtual’ events focused on businesses learning, connecting, networking and building their competitive advantage. This includes some leading edge topics such as podcasting, marketing funnels, lead generation online, Intellectual Property and Tech Ex – an expo of the brightest new tech businesses from Spark Centre.
Check out our conversation with Teresa Shaver to learn more about the Business Advisory Centre Durham.
Small Business Month 2021
Leave a CommentDuring the month of October Canadians from coast to coast to coast recognize and celebrate the significant contributions of entrepreneurs and small businesses to their communities and the entire Canadian economy. Celebrated as Small Business Week since 1979, the event was expanded in 2006 to offer small business owners more opportunities to take advantage of events, seminars, and other resources as they come together to celebrate, learn, and network with other entrepreneurs.
Small businesses are the foundation of the Canadian economy. As of December 2018, there were 1.2 million employer businesses in Canada. Of these, 1.18 million (or 97.9%) were small businesses. Small businesses employed 8.4 million Canadians in 2018, or 69.9% of the total private labour force.
In Durham Region, entrepreneurs are fortunate to have the support and guidance of the Business Advisory Centre of Durham (BACD) to help them start and grow their business. In recognition of Small Business Month, we sat down with Teresa Shaver, the Executive Director of the BACD, to discuss the value of local labour market information and other resources provided by the Durham Workforce Authority. Check out the full video below.
Priority Sector Profile Reports
Leave a CommentThe Durham Workforce Authority (DWA) engaged in five Sector Planning Partnership Grants (SPPG) to better understand the changing landscape in Durham Region. This included the healthcare, logistics, manufacturing, construction, and agriculture sectors.
The five sector profile reports were undertaken to provide an assessment of the current state of each sector at the local level in Durham. The analysis took into account the impacts of local workforce developments, technological advancements, and the pandemic to assess the required, sector-specific, supports required to ensure ongoing, positive growth and development.
The sector profile reports provide a detailed overview of each sector, analyze current data trends, and provide strategic guidance for local intervention in the economic and labour market development of local industry in each sector.
The need for this research was first signaled by the Region of Durham Economic Development and Tourism’s intention to update their regional economic development plan in the near future and workforce development is a key component of this plan. To ensure each of the five sectors continues to grow and thrive within the region, it was essential to study the current state of the sector, the workforce, pandemic, technology impacts, and the required regional sector supports that will influence these sectors.
Click here to view the full sector reports.
DWA Guest Blog: Lorna Weston-Smyth
Leave a CommentHere at Durham Workforce Authority (DWA), we are constantly looking for ways to ensure the community is aware of the valuable resources we provide. As part of that process, we are working to develop a series of monthly blogs to help our stakeholders better understand the value the DWA provides in the community.
For the month of August, we are proud to publish a Guest Blog Post featuring: Lorna Weston-Smyth – Executive Coach and Trainer and Independent Executive Director of the John Maxwell Team, LWS Coaching and Training.
“Adam Grant
‘In a stable world, it’s best to be data-driven. In a changing world, it’s better to be data-informed.
Data can reveal patterns from the past. It takes judgement to predict how those patterns will evolve in the future. Data shouldn’t guide decisions. It should inform decisions.’
In this fast-paced digital world, we have an unprecedented amount of data available at the touch of a button and data is probably the most valuable asset there is. It can tell you if you should wear a rain jacket and when you should get your car serviced before you get stuck on the side of the road in the rain. It can predict a heart attack or natural disasters and so much more.
Seeking out, capturing and harvesting mass amounts of electronic data through a process called “data mining” has raised the bar for knowing how to manage that data so it becomes usable information. That information can then be acted upon by decision makers in virtually any endeavor or company.
Today’s services and industries require a range of options when it comes to leveraging sources of information in order to capitalize on new opportunities, make smarter decisions, forecast trends, identify risks and generally be less vulnerable as an organization. The amount of information available in today’s fast-paced world can be overwhelming. Making good use of this information often requires transforming the data into information that’s more digestible.
For instance, I when attended the Data Walk presented by the Durham Workforce Authority, I learned something important about the skills development training that I offer to my clients. You see, I am an executive coach and trainer and I specialize in teaching leadership and communication skills, the so called soft skills that are much more intangible but have a significant impact on success.
Let me back up for a second and share with you what exactly a Data Walk is. A Data Walk is a regular event that the Durham Workforce Authority hosts that takes the important data they collect and makes it relevant for businesses and organizations in the Durham Region. Heather McMillan and the staff put on presentations around specific data sets that really put a face to the numbers to make it not only understandable but impactful.
One of the sets they did a presentation on was essential skills and employability skills in the under 25 demographic. In that presentation I learned that may of the skills that I deliver training on are in fact employability skills and not only that they showed me the numbers that supported what I already knew from experience but no data to support it.
Having the numbers to support what I knew gave me a way to show my clients and prospects just how important this kind of training is for not only their current workforce but to also help them attract new talent and earns their loyalty. Soft skills ARE essential skills!
Data reveals past instances and gives an idea how to best approach situations and circumstances in the future that we might not have an answer for right now. It also helps us find ways to present our product to the customers and to just understanding them better at any given time.
At its very core, data helps us to establish one of the most important foundations in developing a company, which is effective allocation of time and resources. Data can tell us what we need to do next. It exposes inefficiencies and disadvantages. It reveals truths about our habits and what we might do next.
Data opens windows into opportunity, while offering a glimpse into the future. Data has the power to make those possibilities a reality. The more information we collect regarding customers and sales, for example, the better are our chances of getting some further insight regarding our target market.
Whether you are a large company of a small entrepreneur, you don’t have to do the data mining yourself. The Durham Workforce Authority can help you pull the numbers you need and help you understand what it means. You need to embrace data and learn to use it properly if you want this idea of yours to come to successful fruition.”
Lorna Weston-Smyth – Executive Coach and Trainer and Independent Executive Director of the John Maxwell Team, LWS Coaching and Training.(2021)
The Durham Workforce Authority (DWA) provides local workforce information and champions workforce development initiatives unique to Durham Region.
The DWA is one of a network of 26 Workforce Planning Board areas across the province.
DWA Guest Blog: Bonnie Wrightman
Leave a CommentHere at Durham Workforce Authority (DWA), we are constantly looking for ways to ensure the community is aware of the valuable resources we provide. As part of that process, we are working to develop a series of monthly blogs to help our stakeholders better understand the value the DWA provides in the community.
For the month of July, we are proud to publish a Guest Blog Post featuring: Bonnie Wrightman – Manager of Business Development, Clarington Board of Trade & Office of Business Development.

“Durham Region is fortunate to have an engaging, talented and interactive team at Durham Workforce Authority. The Clarington Board of Trade & Office of Economic Development feels the labour market information collected and presented by DWA, and various formats of data in terms reports made available by DWA, has great value to not only our organization but to our market: members of the Clarington business community.
We are privileged to have the opportunity to access and share relevant data helping to inform employers on labour market trends and labour force activity helping to bridge the gap between employer needs and labour force skill sets. As well, DWA has provided us with community occupation/wage data for employers looking for this information.
Job growth and job demand data have been very useful in helping identify growth trends and industry workforce needs. We also integrate labour force data in our business investment and community profile package – valuable information for any business looking to expand or locate to the Clarington community.”
Bonnie Wrightman – Manager of Business Development, Clarington Board of Trade & Office of Business Development (2021)
The Durham Workforce Authority (DWA) provides local workforce information and champions workforce development initiatives unique to Durham Region.
The DWA is one of a network of 26 Workforce Planning Board areas across the province.
Sector Spotlight: Transportation
Leave a CommentThe transportation & warehousing sector is focused on transporting passengers and goods, warehousing, and storing goods. This sector uses truck, transit and ground passenger, rail, water, air, and pipeline. Durham Region stands at an integral position in the transport activities of this economic region and benefits from several multi-modal transport systems such as three 400 series highways, provincial roads, transit operators such as Metrolinx and Via Rail, a port, and an airport.
Transport and warehousing are one of the main sources of employment and revenue for the Durham Region, with potential for growth.
The Oshawa Executive Airport generates approximately $1.5 million in property tax revenue. Flight training, air ambulance, passenger charter services, freight services, aerial police operations, aircraft maintenance, and aircraft restoration services are all provided at the airport. The airport provides employment to approximately 215 people in various occupations.
The Hamilton-Oshawa Port Authority transports cargo through the St. Lawrence Seaway and the Oshawa port handled 408,000 metric tonnes of cargo in 2017. The Port estimates that 398 jobs are supported by the Port, out of which 150 jobs are directly generated by the marine cargo and vessel activity at the marine terminals.
Durham Region is emerging as a destination for distribution centers due to the availability of well-connected road networks. Employment in warehousing is growing; the following table shows the major transportation occupations in the Region:
| Occupations | Total Employed |
| 7452 Material handlers | 1,175 |
| 7511 Transport truck drivers | 1,175 |
| 7512 Bus drivers, subway operators, and other transit operators | 900 |
| 1512 Letter carriers | 385 |
| 1521 Shippers and receivers | 310 |
| 6622 Store shelf stockers, clerks, and order fillers | 225 |
| 1511 Mail, postal, and related workers | 220 |
| 1525 Dispatchers | 215 |
| 7513 Taxi and limousine drivers and chauffeurs | 190 |
| 0731 Managers in transportation | 185 |
Census 2016 |
|
In air transportation, people aged 25-44 years form 70 percent of the total employment and the rest are between 45-54 years old. Employees over 55 years and over form 30 percent of employment in the industry and with almost half of the transit and ground passenger transportation being 55 years and over.
The Durham Workforce Authority (DWA) provides local workforce information and champions workforce development initiatives unique to Durham Region.
The DWA is one of a network of 26 Workforce Planning Board areas across the province.
Photo Credit: https://www.freepik.com/free-photos-vectors/character”>Character vector created by vectorjuice – www.freepik.com
Census Metropolitan Unemployment Rates Across Ontario
Leave a CommentClick Here to See Larger Image

The Unemployment Rate Comparison graph provides a visual display of the monthly unemployment rates for various Census Metropolitan Areas (CMA) across Ontario. The unemployment rate is the number of unemployed persons expressed as a percentage of the labour force. Estimates are percentages, rounded to the nearest tenth.
The Oshawa CMA is comprised of Oshawa, Whitby and Clarington. The Oshawa CMA is used as a data proxy in Durham Region as Pickering, Ajax and Uxbridge are part of the Toronto CMA and Brock and Scugog are not surveyed in the monthly report due to population size. The Oshawa CMA includes the most Durham Region residents and provides the best depiction of the labour market in the Region as a whole.
The Unemployment Rate Comparison graph reflects many of the job losses and recoveries experienced across various areas in the Greater Golden Horseshoe as a result of COVID-19. Now over a year and a half into COVID, we are seeing some of the extended effects of COVID-19 on the Canadian economy. Initially, in March 2020 as public health measures were first implemented, there was a spike in all areas across the Greater Golden Horseshoe. We saw a gradual decline throughout the summer and into the autumn months as various businesses began to re-open after the first wave of the virus.
In Ontario, the highest unemployment rate among the comparators in August 2021 was Windsor at 11.2% The lowest unemployment rate among the comparators continues to be the Peterborough CMA which saw a slight reduction from 7% to 6.5%. Looking forward the data should reflect the easing of stricter public health measures introduced across the country.
Source: Statistics Canada. Table 14-10-0378-01, Labour force characteristics, three-month moving average, unadjusted for seasonality (August 2021).
DWA is Proud to Announce Sector Planning Partnership Grants
Leave a CommentThe Durham Workforce Authority is proud to announce they have been awarded five Sector Planning Partnership Grants (SPPG) by the Ontario Ministry of Labour, Training and Skills Development (LTSD). These projects will focus on engaging employers from the logistics, agriculture, construction, manufacturing, and healthcare sectors to understand their challenges with the workforce and develop strategic plans to support them through the COVID-19 recovery and beyond.
Working in conjunction with community partners, the projects will amalgamate information gathered from an employer summit, key informant interviews, and the most recent DWA Employer Survey with existing economic development plans to develop fulsome strategic plans.
Each plan will identify sector-specific needs and opportunities, and propose solutions, to:
- help employers effectively connect with job seekers who have their desired skill sets;
- identify opportunities to provide training to workers that support skill development (including literacy and essential skills) and advancement;
- help those looking for employment connect their skill set with in-demand jobs in specific sectors;
- address workforce needs and gaps in key sectors by bringing together employers, training providers, employment services, and workforce planning organizations;
- better align regional industry workforce needs with government investments in skills training and workforce development.
Local perspectives and knowledge are important aspects of an integrated system for effectively addressing employment, training, and labour market issues. These reports will explore the role of employers in demand-led training and experiential learning as well as the role that LTSD funded service providers can play in assisting local employers with all forms of workforce development.
“The Durham Workforce Authority is grateful to the Ministry of Labour, Training, and Skills Development for this investment in supporting local employers in several key sectors. These funds will enable a robust employer consultation and research process that will result in the development of strategic plans on how resources can best be leveraged to support these employers in Durham Region.”
Heather McMillan, Executive Director, Durham Workforce Authority
For more information or to arrange an interview with Heather McMillan please click HERE.
Census Metropolitan Unemployment Rates Across Ontario
Leave a CommentClick Here to See Larger Image
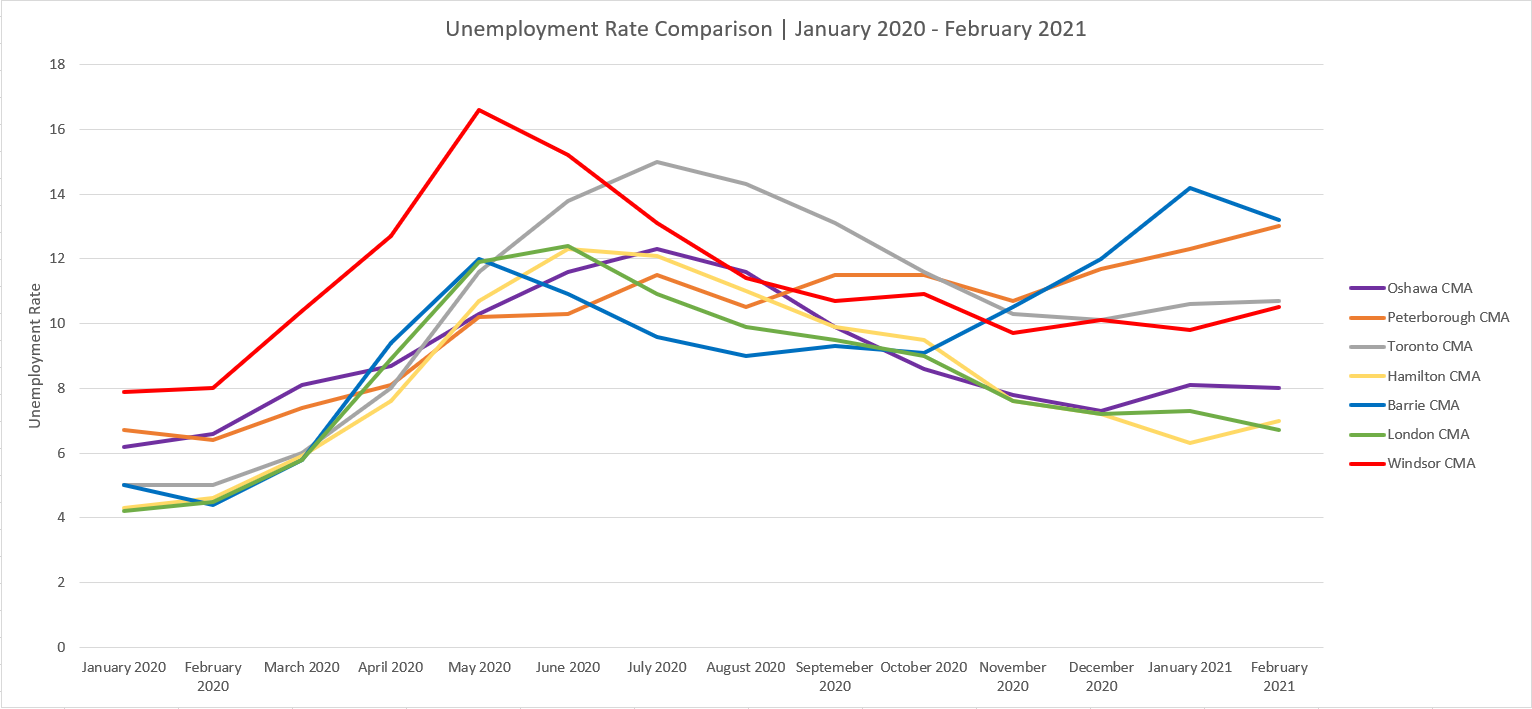
The Unemployment Rate Comparison graph provides a visual display of the monthly unemployment rates for various Census Metropolitan Areas (CMA) across Ontario. The unemployment rate is the number of unemployed persons expressed as a percentage of the labour force. Estimates are percentages, rounded to the nearest tenth.
The Oshawa CMA is comprised of Oshawa, Whitby and Clarington. The Oshawa CMA is used as a data proxy in Durham Region as Pickering, Ajax and Uxbridge are part of the Toronto CMA and Brock and Scugog are not surveyed in the monthly report due to population size. The Oshawa CMA includes the most Durham Region residents and provides the best depiction of the labour market in the Region as a whole.
The Unemployment Rate Comparison graph reflects many of the job losses and recoveries experienced across various areas in the Greater Golden Horseshoe as a result of COVID-19. Now almost one year into COVID, we are seeing some of the extended effects of COVID-19 on the Canadian economy. Initially, in March 2020 as public health measures were first implemented, there was a spike in all areas across the Greater Golden Horseshoe. We saw a gradual decline throughout the summer and into the autumn months as various businesses began to re-open after the first wave of the virus. Looking at January and February 2021, we can now see the lingering effect of the second wave on unemployment. While Barrie CMA had a major spike in January, we are now seeing a gradual decline as businesses are able to reopen – Barrie now sits at a 13.2% unemployment rate.
Peterborough CMA now sits at 13% with a continual upward trend in unemployment since November, now competing with Barrie CMA. Toronto and Windsor have similar unemployment rates at 10.7% and 10.5%, respectively. The effect of the second wave on unemployment in the Oshawa CMA has not been as severe as the first. While Oshawa CMA saw a smaller bump in January 2021, it held nearly the same in February 2021 at 8%.
In Ontario, the highest unemployment rate in February 2021 was 13.2% in the Barrie CMA. The lowest unemployment rate in the province is 6.2%% in the Ottawa-Gatineau CMA. Looking forward the data should reflect the regional approach to the implementation of stricter public health measures, with some regions placed in grey and others in different zones of Ontario’s colour-coded system. In the coming months, the data could also begin to show the effect of the vaccine rollout in the province.
Source: Statistics Canada. Table 14-10-0378-01, Labour force characteristics, three-month moving average, unadjusted for seasonality (March 2021).