Archive
2025 Data Walk – Exploring the Stories Behind the Numbers
Leave a CommentThe Durham Workforce Authority (DWA) hosted its 2025 Data Walk to bring local labour market information to life. The event showcased key data and trends shaping Durham Region’s economy through six themed research stations, each focused on a different aspect of our workforce.
Traditional reports can make labour market information feel abstract or hard to connect to everyday realities. The Data Walk format changes that; it invites people to move, read, and discuss, offering an interactive platform for community members, employers, educators, and policymakers to explore the data that informs decision-making in Durham Region. Participants “walk through” poster displays and speaker sessions, learning how the latest research connects to real-world issues such as skills shortages, youth unemployment, and emerging industries. Each station combined visuals, data charts, and speaker insights to make the findings meaningful. By linking statistics to local experience, participants could see how the numbers reflect the challenges and opportunities in Durham’s workforce today.
Six Stations, One Local Story
The 2025 Data Walk featured six research stations, each focusing on an essential part of Durham’s labour market. Together, they told a story of resilience, transition, and opportunity.
-
Skilled Trades – Highlighted the growing demand for apprenticeships and certifications in Durham, including trends in diversity and age among skilled trades workers.
-
Future Energy – Showed how Durham’s energy sector is transforming with new technologies, clean energy projects, and the skills needed to support them.
-
Unemployment – Explored youth unemployment and visible minority unemployment rates, uncovering barriers and potential solutions to workforce participation.
-
Job Vacancies and Business Obstacles – Examined the challenges employers face recruiting and retaining skilled employees, and where labour shortages are most pressing.
-
Workforce Survey – Shared insights from DWA’s 2024 Workforce Survey, which collected data directly from Durham residents about employment, education, and local services.
-
Jobs First Durham Tools – Demonstrated the value of DWA’s online tools, which connect job seekers and employers while providing real-time data on job postings, wages, and skills.
Connecting Data to Action
The Data Walk isn’t just about sharing research, it’s about sparking dialogue. Participants discussed how these findings can inform workforce planning, education, and community development across Durham Region.
The event highlighted the DWA’s ongoing commitment to making local labour market information accessible and actionable. Whether it’s tracking job postings through Jobs First Durham, exploring emerging sectors like Future Energy, or addressing barriers to employment, the DWA’s research is designed to help community partners respond effectively to Durham’s evolving economy.
About the DWA:
The DWA creates an annual plan supplying helpful information for community planning. Next month, the DWA will release its annual Labour Market Plan (LMP).
The plan focuses on the following:
- Durham Region demographics change, migration trends in and out, educational attainment of residents, and changes in employers in the local area by employee size and 3-digit NAICs.
- Enhanced Jobs First Durham (JFD) data extracted from the DWA’s boutique job board with hyper-local information.
- An update on Employment Ontario data.
The DWA provides just-in-time custom labour market information and often conducts custom fee-for-service research. If you are interested in local data, please don’t hesitate to contact the DWA.
The Province of Ontario partially funds the DWA to supply Labour Market Information (LMI) to the Region of Durham.
What Jobseekers Are Looking for in Durham: Q3 2025 Insights
Leave a CommentAs job demand remains strong, so too does jobseeker engagement. The Labour Market Insights Report for 2025 Q3 shows 38,561 total interactions across Durham Workforce Authority’s digital tools during Q3 2025, up from 34,758 in Q2.
Job Board and Search Trends
The Job Board remains the most popular resource, with 24,535 interactions and 20,289 job post clicks.
Searches were heavily concentrated in sales and service occupations, with top job titles including:
- Retail salespersons
- Material handlers
- Food counter attendants
- Home support workers
Top search keywords included “warehouse,” “retail,” “Oshawa,” and “personal support worker”, which show that Durham residents remain focused on practical, locally accessible employment.
Jobseeker Preferences
Special interest searches reveal that flexibility remains a top priority. The most commonly used filters were for work-from-home, apprenticeship, and casual employment opportunities.
This interest in non-traditional or flexible roles suggests that many job seekers are balancing employment with other responsibilities or seeking to gain experience through part-time or contract work.
Who’s Engaging and Where
Engagement levels were highest among individuals seeking sales, service, and trade-related occupations, particularly within TEER 4 and 5 skill levels.
The majority of jobseeker activity came from Durham’s largest cities, including Oshawa, Whitby, and Pickering, which aligns with the location of most job postings.
A Dynamic, Connected Workforce
Durham’s job seekers continue to demonstrate adaptability and persistence. They are leveraging multiple tools, including the Job Board and Job Map, as well as the Career Explorer, to connect with employers and explore opportunities.
As Q3 draws to a close, the balance between high employer demand and active jobseeker engagement reflects a healthy, responsive local labour market, one that continues to evolve toward greater transparency, flexibility, and opportunity for all.
Who’s Hiring in Durham? A Look at Job Demand in Q3 2025
Leave a CommentDurham Region’s job demand remained strong in Q3 2025, with 11,189 new job postings and 12,954 active listings overall. This consistent level of employer activity shows confidence in the regional economy and the continued need for skilled and service-oriented workers.
Top Occupations
The most in-demand jobs this quarter reflect both stability and transition within Durham’s workforce:
- Food counter attendants and kitchen helpers (NOC 65201) – 1,561 postings
- Home support workers and caregivers (NOC 44101) – 1,067 postings
- Registered and licensed practical nurses (NOC 31301, 32101) – over 1,100 combined postings
- Retail salespersons and merchandisers (NOC 64100) – 2,175 postings (still high, but continuing to decline)
These patterns highlight persistent demand in health, caregiving, and service roles—fields that have led job growth throughout 2025.
Sector Trends
The health care and social assistance sector remained Durham’s top employer, followed closely by retail trade, education, and administrative support services.
While the administrative and support sector saw a sharp 39% decline, agriculture, forestry, fishing and hunting continued its steady climb, showing growth for the second quarter in a row.
Wages and Skills
Wages rose modestly this quarter, with an average posted hourly wage of $28.20 and a median of $23.32. Wage increases were most notable in manufacturing, construction, and utilities, where demand for skilled trades and technical expertise remains strong.
Employers emphasized communication, customer service, and organizational skills, while roughly 85% of postings did not specify formal education or experience requirements, making many roles accessible to new entrants and career changers.
Durham’s Q3 data reinforces what we’ve seen throughout 2025: the region’s workforce remains active and opportunity-rich, but job demand continues to centre on service, care, and trade-based occupations.
Durham’s Labour Market in Q3 2025 – Steady Growth Amid Shifting Sectors
Leave a CommentDurham Region’s labour market remained active and stable through the third quarter of 2025, showing both resilience and evolution. The latest Labour Market Insights Report for Q3 2025 from the Durham Workforce Authority reveals 12,954 active job postings and 11,189 new listings, continuing the upward trajectory seen earlier this year.
While the number of employers hiring dipped slightly to 3,655, the region’s job market remains competitive. The average posting duration rose to 17 days, suggesting that while demand is strong, employers may be taking more time to find the right candidates.
Sector Shifts
The health care and social assistance sector continued to lead the way with 2,060 postings, followed closely by retail trade (2,050) and educational services (994). However, some sectors saw significant declines, particularly administrative and support services (-39%) and education (-41%), likely due to seasonal trends.
In contrast, agriculture, forestry, fishing and hunting was the fastest-growing sector for the second consecutive quarter, up 21%, reflecting ongoing diversification in Durham’s local economy.
Wages and Job Quality
Durham’s wage levels improved again, with the average posted wage rising to $28.20 per hour. Full-time work accounted for 75% of postings, and 89% of roles were permanent, signs of a healthy and stable employment landscape.
Jobs in manufacturing, utilities, and construction saw notable wage gains, while education and professional services experienced modest decreases. The strongest individual wage growth occurred among motor vehicle assemblers, psychologists, and hairstylists/barbers.
A Labour Market in Transition
Durham’s economy is clearly evolving. Healthcare and support roles continue to expand, while retail and administrative support are cooling after several strong quarters. Employers are consistently demonstrating a demand for essential soft skills, including communication, management, and customer service, while wage transparency continues to improve.
As 2025 moves into its final quarter, Durham’s labour market stands on a solid footing, resilient, adaptive, and increasingly focused on skill-based growth that supports both employers and job seekers.
Youth Unemployment Statistics
Leave a CommentYouth employment is an essential issue for Canadians. Youth unemployment in Canada is increasing: Young people in Canada are finding it more difficult to find jobs (summer and post-graduate) amid rising competition and a softening labour market.
On average, according to Statistics Canada, youth unemployment nationally tends to be twice the adult unemployment rate (in August, the overall unemployment rate was 9.4%). In other words, if the unemployment rate for a jurisdiction is five percent, the youth unemployment rate should be somewhere between 10 and 12.5 percent.
In addition, unemployment rates can be challenging because Statistics Canada does not make this data available by city. Unemployment rates are available monthly for the census metropolitan area. For Durham, the Oshawa Census Metropolitan Area (CMA) comprises Whitby, Oshawa, and Clarington. Ajax, Pickering, and Uxbridge are part of the Toronto Census Metropolitan Area, which includes the York and Peel regions. Brock and Scugog are statistically too small to be included in Statistics Canada’s monthly surveys. While the Oshawa CMA is used as a proxy for Durham Region, access to CMA-level labour force data, available only in Census years, impacts community planning.
Youth unemployment averaged 18 percent from 2015 until 2025. This aligns with youth unemployment rates from 2010 to 2015. Recently, much discussion has ensued as various community-serving organizations, Employment Ontario service providers, municipal government, federal and provincial ministries, and educational institutions attempt to determine the primary reason(s) for sustained youth unemployment and strive for solutions
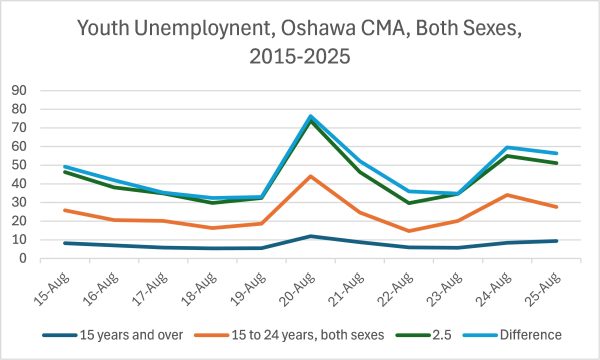
Table: 14-10-0458-01
Unemployment is Different by Gender
Unemployment is higher among young men. Unemployment patterns vary across gender and age groups, there are several factors. These include racialized gaps in educational completion, uneven skills development opportunities, and a fragmented institutional support system. Racialized youth unemployment for both sexes is significantly higher, depending on the racialized group. For instance, the South Asian male unemployment rate is 40 percent, and the unemployment rates for Arab and Black women are 28 and 26 percent.
As Ontario and the Durham Region struggle through a shallow recession caused by ongoing economic instability resulting from tariffs, companies are sharply reducing their hiring of entry-level workers. As a result, students and new graduates are grappling to find work. Delayed unemployment impacts productivity, economic prosperity and can lead to so-called labour market scarring as youth struggle to obtain a foothold in the labour market.
Humble Suggestions to Support Youth
- Employer Engagement by Sector to understand job vacancies and engage Employment Services to support labour market attachment
- Encourage youth to leverage Jobs First Durham’s free resources
- Business Education Workshops, Industry Roundtables,
- Create recovery jobs inventory
- Create a Durham Needs You.ca website to promote occupations in demand in the region
About the DWA:
The DWA creates an annual plan supplying helpful information for community planning. Next month, the DWA will release its annual Labour Market Plan (LMP).
The plan focuses on the following:
- Durham Region demographics change, migration trends in and out, educational attainment of residents, and changes in employers in the local area by employee size and 3-digit NAICs.
- Enhanced Jobs First Durham (JFD) data extracted from the DWA’s boutique job board with hyper-local information.
- An update on Employment Ontario data.
The DWA provides just-in-time custom labour market information and often conducts custom fee-for-service research. If you are interested in local data, please don’t hesitate to contact the DWA.
The Province of Ontario partially funds the DWA to supply Labour Market Information (LMI) to the Region of Durham.
Durham’s Labour Market: Key Insights from August 2025
Leave a CommentThe Jobs First Durham Job Demand and Job Search reports for August show a complex picture of steady employer demand alongside active but selective job seeker engagement in Durham. These reports highlight where opportunities are emerging, where challenges persist, and what this means for both job seekers and employers.
Employer Demand Remains Strong
In August, employers across Durham posted 5,531 active job ads, which is a 4% increase from July, including 3,724 new postings. More than 2,200 companies were hiring, a 5% increase from July, and the majority of positions (77%) were full-time, permanent roles.
High-demand roles include:
-
Food counter attendants and kitchen helpers
-
Home support workers and caregivers
-
Registered nurses and psychiatric nurses
At the same time, some traditional occupations, such as retail salespersons, customer service representatives, and elementary school teachers, while remaining strong, did see a decline in postings.
Job Seeker Activity: Targeted but Concentrated
The Job Search Report shows 12,179 interactions with online tools in August, including 6,189 clicks on job postings, a 13% drop from July. Top occupations job seekers clicked on include:
-
Retail salespersons
-
Material handlers
-
Home support workers and caregivers
-
Food counter attendants
-
Construction labourers
This suggests that while employer demand is strong in healthcare, food services, and building maintenance, many job seekers continue to focus on retail and entry-level service roles, where postings are actually declining.
Wage and Skills Trends
The average posted wage in August was $27.86/hour, down 2% from July, with a median of $23.13/hour. Some roles, such as motor vehicle assemblers and psychologists, saw significant wage growth, while others, like teachers and lab technologists, experienced wage declines.
Employers continue to emphasize soft skills, such as communication, customer service, and teamwork, alongside practical requirements like first aid training, proficiency in Microsoft Office, and criminal record checks.
What This Means for Job Seekers
-
Opportunities exist across industries, particularly in healthcare, food services, and skilled trades. Job seekers who can pivot toward these areas may find more stable and better-paying roles.
-
Transferable skills, such as communication, customer service, and problem-solving, are in high demand and can help job seekers transition into growing fields.
-
Awareness of wages is important. Some declining occupations are offering relatively high pay, but these roles may be more challenging to secure as fewer postings become available.
What This Means for Employers
-
Hiring competition remains high, with thousands of postings online. Employers need to stand out through clear job ads, competitive wages, and advertised benefits.
-
Recruitment challenges in growing sectors, such as healthcare, caregiving, and skilled trades, continue to face shortages, suggesting that employers may need to broaden their candidate pipelines and invest in training.
-
Disconnect with job seeker interest, as many candidates are still looking at retail and general labour roles, despite a decline in postings in those areas. Employers in growth sectors may need to do more outreach to attract and reskill these job seekers.
Final Takeaway
Durham Region’s August 2025 labour market highlights a dual challenge, as employers are eager to fill roles in growing sectors such as healthcare, caregiving, and building maintenance, while many job seekers are still drawn to retail and entry-level positions with shrinking demand. Bridging this gap through improved career awareness, training pathways, and targeted employer outreach will be key to maintaining Durham’s labour market balance and resilience.
Canada Summer Jobs at Work: How Students Grew with the DWA
Leave a CommentThe DWA was fortunate to receive Canada Summer Jobs funding for two summer students in 2025. This program enables organizations to offer summer employment to young Canadians, allowing them to develop their skills through real-world work experience. Below, these students share their experiences of working at the DWA this summer.
Marketing Research – Zarish F
From May to August, I had the opportunity to intern with the Durham Workforce Authority as a Marketing Researcher, and it was such a rewarding experience.
During my time there, I got to work on a variety of projects that allowed me to grow both creatively and professionally. I was heavily involved in content creation using Canva, which gave me the chance to experiment with different styles and sharpen my design skills. I also contributed to developing the survey marketing plan and supported the logo/rebrand launch both of which were an exciting project to be a part of. Seeing how ideas evolve into real strategies was incredibly valuable.
One of the things I appreciated most was the flexible, stay-at-home work style. The DWA team, Eric and Heather, were not only accommodating to my needs but also genuinely supportive of my learning journey. They encouraged me to share my ideas, gave me exposure to new areas of marketing research and always created space for growth. I truly felt heard and respected, which made the experience even more meaningful.
Looking back, I am grateful for the trust, flexibility and mentorship I received. I will definitely miss my time at DWA and will carry the lessons and experiences with me as I move forward.
Database Administrator – Bilal S
For the past four months, I have been working as a database administrator for the Durham Workforce Authority. During this internship I learned many things and benefited in various different ways that will contribute to my future success in my career path.
As a post-secondary student studying in a computer science-related field, this position has helped me learn a lot about writing code in a work environment. I’ve learned that thorough testing is required and that consistent communication is key. This is because it is very important that my manager is always up to date on my progress on a weekly basis.
Furthermore, I’ve been able to greatly strengthen my self-regulation and time management skills throughout my experience at this job, as it is a very different kind of experience from schoolwork. I believe these things will help contribute to my future career success because the specific ways in which I learned these lessons are going to be much more beneficial to me in future work environments.
Moreover, I was also able to strengthen my technical skills with my work this summer in a way that will be appealing to future employers. This is because I was able to get a lot more experience coding with Python and scripting tests, which are both tasks that come up very often in the software engineering field. So, on top of the soft skills I strengthened, I was also able to gain more technical skills through this work experience.
Overall, my summer internship with the Durham Workforce Authority has left me with a lot of lessons learned, and it is because of these lessons that I feel a lot more optimistic about my future career prospects.
Temporary Foreign Workers and Durham’s Labour Market: What the Data Shows
Leave a CommentTemporary Foreign Workers and the Local Labour Market
Temporary foreign workers have been coming to Canada for about 60 years. Simply put, foreign workers are people who come to live and work in Canada for a defined time, such as farm workers.
The Temporary Foreign Worker Program (TFWP) recruits people exclusively to ease short-term labour shortages.
Recently, concerns have been raised about the impact this program has on the labour market, particularly its effect on the local labour market. Not all the data is available at the Census Metropolitan Area (CMA) level, but up-to-date data can be located in this blog.
Temporary foreign workers include work permit holders, study permit holders and asylum claimants who are engaged in work activity in Canada
- Temporary foreign workers are non-permanent residents with employment income in Canada who may hold permits for work, study or other purposes.
- Work permit holders fall under the Temporary Foreign Worker Program (TFWP) and the International Mobility Program (IMP). Some IMP permits are not for work purposes.
- Not all work permit holders worked in Canada each year. About 87% of TFWP permit holders and 69% of IMP permit holders for work purposes had earnings in 2021.
- In 2021, 58% of non-permanent residents holding both work and study permits were employed, while 34% of those having only study permits were employed.
- Holders of permits for non-work purposes accounted for 42% of temporary foreign workers in 2021, with the majority being international students.
- Businesses are required to complete a Labour Market Impact Assessment ,but the Durham Workforce Authority may not be contacted to provide data to the application.
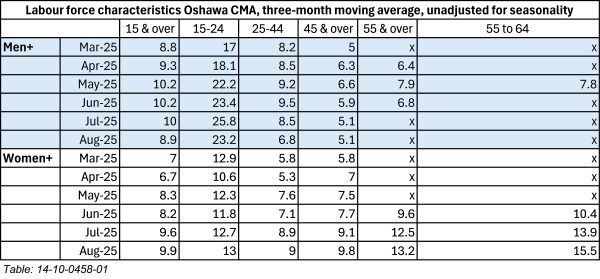
Youth Unemployment, Oshawa CMA
According to Statistics Canada, the normal rate for youth unemployment should be 2.5 times the total unemployment rate for individuals 15 years and older. The youth unemployment rate in the Oshawa CMA has decreased year-over-year. The total unemployment rate in July was 9.8 percent, meaning the youth unemployment rate should be 24.5 percent. According to the chart below, the youth unemployment rate is 17.8 percent.

Immigrant Unemployment by Economic Region
Immigrant unemployment is available by Economic Region monthly rather than by the CMA. This chart shows the total population unemployment at 6.9 percent for July 2025 and the unemployment rates for immigrants who have been landed 5 years or less are significantly higher.
| Immigrant Unemployment Rate by Toronto Economic Region (Percentages) | |||||||||||||
| 15 years and over | |||||||||||||
| Immigrant status | 24-Jul | 24-Aug | 24-Sep | 24-Oct | 24-Nov | 24-Dec | 25-Jan | 25-Feb | 25-Mar | 25-Apr | 25-May | 25-Jun | 25-Jul |
| Total population | 6.4 | 6.8 | 6.7 | 6.5 | 6.2 | 6.2 | 6.6 | 6.6 | 6.9 | 6.9 | 7 | 6.8 | 6.9 |
| Landed immigrants | 7.5 | 7.9 | 7.8 | 7.6 | 7.2 | 7.1 | 7.4 | 7.3 | 7.6 | 7.5 | 7.8 | 7.6 | 7.8 |
| Immigrants, landed 5 or less years earlier | 12.5 | 12.2 | 11.7 | 10.8 | 10.2 | 9.6 | 10.3 | 10.3 | 10.9 | 10.6 | 11.1 | 10.9 | 11.2 |
| Immigrants, landed more than 5 to 10 years earlier | 8.6 | 9.5 | 9.4 | 8.9 | 8.3 | 8.2 | 8.6 | 8.6 | 8.7 | 8.6 | 8.9 | 8.9 | 8.6 |
| Immigrants, landed more than 10 years earlier | 5.7 | 6.1 | 6.2 | 6.2 | 5.9 | 6.1 | 6.2 | 6.1 | 6.3 | 6.3 | 6.5 | 6.4 | 6.6 |
| Born in Canada | 5.6 | 5.9 | 5.9 | 5.6 | 5.3 | 5.4 | 5.8 | 5.9 | 6.3 | 6.3 | 6.3 | 6.1 | 6.2 |
Statistics Canada. Table 14-10-0471-01
Businesses Using the Temporary Foreign Worker Program
This chart illustrates which provinces and sectors utilize the Temporary Foreign Worker Program. The highlighted sectors using it most are:
- Agriculture
- Mining
- Arts and Recreation
- Accommodation and Food Service
The provinces with the highest use of the program are:
- Newfoundland and Lab
- Nova Scotia
- Quebec
- Ontario
| Business hired workers through TFWP in the last 12 months, second quarter of 2023 | ||||||||||||||
| Geography | Canada | NL | PEI | NS | NB | QC | ON | MB | SK | AB | BC | YT | NWT | NU |
| North American Industry Classification System (NAICS), all industries | 5.4A | 2.3A | 4.5A | 5.0A | 3.8A | 7.3A | 4.1A | 5.5A | 4.6A | 5.0A | 6.8A | 6.9A | 6.5A | 1.9A |
| Agriculture, forestry, fishing and hunting [11] | 14.8A | 2.5A | 8.9B | 9.8C | 4.4A | 29.7C | 17.5B | 2.7A | 1.6A | 5.6B | 13.4B | 0.0A | X | 0.0A |
| Mining, quarrying, and oil and gas extraction [21] | 1.1A | 16.8D | 0.0A | 0.0A | 0.0A | 3.8B | 1.3A | 1.6A | 0.0A | 0.0A | 2.6A | 0.0A | 16.1E | 0.0A |
| Construction [23] | 5.1A | 3.6B | 2.2A | 2.5A | 2.2A | 0.9A | 8.2C | 0.6A | 2.3A | 7.1C | 7.3B | 3.7B | 0.0A | 8.4C |
| Manufacturing [31-33] | 9.6A | 1.6A | 12.2C | 5.0A | 14.4C | 10.7B | 6.0B | 2.7A | 9.0C | 7.5B | 18.8D | 0.0A | 0.0A | 0.0A |
| Wholesale trade [41] | 2.8A | 0.0A | 0.0A | 5.9B | 0.9A | 2.6A | 3.5A | 0.0A | 1.3A | 3.3B | 1.4A | F | F | 0.0A |
| Retail trade [44-45] | 6.1A | 0.1A | 5.0B | 0.0A | 7.0B | 12.7C | 0.0A | 16.4C | 14.1C | 9.2C | 6.4B | 12.2C | 2.6A | 0.0A |
| Transportation and warehousing [48-49] | 1.4A | 0.0A | 6.5C | 0.7A | 1.2A | 4.2B | 0.0A | 3.1A | 0.7A | 2.2A | 0.8A | 10.3D | 0.0A | 0.0A |
| Information and cultural industries [51] | 3.2A | 0.0A | 0.0A | 0.0A | 2.8A | 5.2B | 0.2A | 0.0A | 1.4A | 0.1A | 9.7C | 0.0A | 0.0A | 0.0A |
| Finance and insurance [52] | 1.3A | 0.0A | 6.4C | 0.0A | 1.6A | 2.6B | 0.4A | 1.8A | 0.0A | 0.0A | 3.4A | 0.0A | 2.6A | 13.7D |
| Real estate and rental and leasing [53] | 3.5A | 1.7A | 0.0A | 5.4C | 1.0A | 0.6A | 6.2C | 3.3B | 9.0C | 0.1A | 1.1A | 0.0A | 0.0A | 0.0A |
| Professional, scientific and technical services [54] | 4.1A | 1.1A | 0.3A | 8.3B | 0.0A | 7.9B | 4.7B | 1.3A | 3.6B | 2.4A | 0.6A | 1.3A | 0.0A | 0.0A |
| Administrative and support, waste management and remediation services [56] | 5.1A | 4.4B | 5.3A | 0.0A | 0.0A | 13.2C | 2.6A | 1.6A | 0.3A | 3.3A | 6.0B | 0.0A | 0.0A | 0.0A |
| Health care and social assistance [62] | 2.8A | 0.0A | 3.3A | 2.0A | 1.7A | 2.1A | 0.1A | 6.8B | 4.7B | 2.8A | 9.0C | 6.1B | F | 3.0A |
| Arts, entertainment and recreation [71] | 1.9A | 0.0A | 1.3A | 0.0A | 0.9A | 2.8A | 0.7A | 1.3A | 1.6A | 2.5A | 2.5B | 9.2B | 0.0A | 0.0A |
| Accommodation and food services [72] | 13.3A | 14.6C | 8.0B | 29.7B | 15.3B | 11.6B | 8.2B | 19.2C | 14.7C | 19.5C | 19.6C | 17.9D | 24.6E | 0.0A |
| Other services (except public administration) [81] | 5.4A | 0.0A | 0.0A | 0.0A | 0.0A | 5.0B | 7.6C | 6.6B | 1.2A | 0.8A | 7.2B | 0.0A | 6.9C | 0.0A |
Statistics Canada. Table 33-10-0678-01
This chart shows the size of businesses that use the program. Most businesses using it are larger, with over 100 employees.

In response to growing concerns about the worker program, the DWA will track their impacts on Durham’s clusters and economic sectors as data becomes available.
About the DWA:
The DWA creates an annual plan supplying helpful information for community planning. Next month, the DWA will release its annual Labour Market Plan (LMP).
The plan focuses on the following:
- Durham Region demographics change, migration trends in and out, educational attainment of residents, and changes in employers in the local area by employee size and 3-digit NAICs.
- Enhanced Jobs First Durham (JFD) data extracted from the DWA’s boutique job board with hyper-local information.
- An update on Employment Ontario data.
The DWA provides just-in-time custom labour market information and often conducts custom fee-for-service research. If you are interested in local data, please don’t hesitate to contact the DWA.
The Province of Ontario partially funds the DWA to supply Labour Market Information (LMI) to the Region of Durham.
What Jobseekers Are Looking for in Durham – JFD Insights from Q2 2025
Leave a CommentUnderstanding jobseeker behaviour is just as important as tracking employer demand. In Q2 2025, over 34,000 job seeker interactions were recorded across the Durham Workforce Authority’s tools, giving us a clear view of how people are navigating the job market.
The Job Board remained the most used tool, with 20,591 interactions and 15,341 job post clicks. The top search terms included “warehouse“, “retail“, “customer service“, and “restaurant staff” — reflecting continued interest in accessible, entry-level roles.
The Career Explorer, Job Map, and Portal also logged thousands of interactions, reinforcing that job seekers are using multiple tools to find the right fit.
When we look at occupational interests, sales and service occupations continued to dominate, especially within TEER 4 and 5 categories, which typically include roles that require little formal education or experience. However, there was also engagement with health-related and administrative roles, suggesting that some job seekers are exploring paths into more stable or higher-paying careers.
Interestingly, the most used filters on the Job Board showed a strong preference for work-from-home, seasonal, and casual opportunities. This indicates that flexibility remains a top priority for many individuals—whether due to caregiving responsibilities, transportation barriers, or other personal circumstances.
As Durham’s economy evolves, these insights show that job seekers are not just looking for work—they’re looking for work that fits their lives. Whether that’s a stepping stone role, a flexible job that balances family needs, or an entry point into a new industry, understanding these preferences helps employers and service providers better meet people where they are.
Who’s Hiring in Durham? A Deep Dive into Job Demand in Q2 2025
Leave a CommentDurham Region saw a notable increase in job demand in Q2 2025. Employers posted 11,048 new job postings—an 18% increase from the previous quarter. The total number of active postings rose to 12,660, and full-time, permanent roles remained dominant, reflecting continued stability in the local employment landscape.
The most in-demand occupations shifted dramatically this quarter. At the top were:
- Registered nurses and psychiatric nurses (NOC 31301) – 1,256 postings
- Food counter attendants and kitchen helpers (NOC 65201) – 1,442 postings
- Home support workers and caregivers (NOC 44101) – 1,038 postings
Interestingly, retail salespersons and merchandisers, the top occupation in Q1, dropped significantly to 2,191 postings, indicating decreased hiring activity in that sector.
Across sectors, health care and social assistance retained its lead, with 2,168 postings, and continues to reflect systemic demand for care workers. Retail remained second overall in total postings but showed signs of slowing, while agriculture, forestry, fishing and hunting emerged as a top growth sector, albeit from a smaller base.
The most requested skills included communication, management, customer service, and driving, highlighting the continued importance of general workplace competencies across industries. In terms of compensation, the average posted wage rose to $27.73/hour, with top-paying roles found in health care, trades, and retail management.
This quarter’s data also shows increased clarity in job listings: more employers are specifying wages and requirements, making it easier for job seekers to assess opportunities. Still, most postings required no specific education or prior experience, reinforcing that many roles remain accessible but may offer limited upward mobility without additional training or credentials.